| 1. | |
2. | |
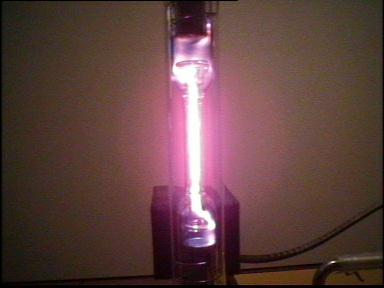
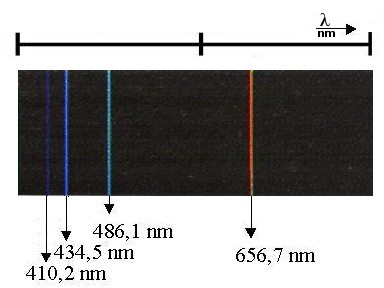
| Hydrogen lamp | Spectrum of the hydrogen lamp |
| Photo 1: | The photo shows a hydrogen lamp. Hydrogen molecules in the lamp are dissociated into excited hydrogen atoms using an electron ray. The molecules then give up their energy of excitation in the form of electromagnetic radiation. Some of this electromagnetic radiation lies in the area of visible light. |
| Photo 2: | The hydrogen lamp does not produce a continuous spectrum, in contrast to the Wolfram lamp depicted in Experiment 2.7.1. Rather, it produces discreet lines. Four of these spectral lines are in the range of visible light. The rest lie in the ultraviolet and infrared regions. Out of the four present in the visible light area, red appears the brightest, which is why the hydrogen lamp appears red to the naked eye. |
![]() ,
, ![]() ,
n=whole number, n2 > n1
,
n=whole number, n2 > n1
(For the Balmer series, n2=2)
The Balmer series and the Rydberg formula were an important basis for
the construction of the Bohr model of the atom.
| Exercise 2.7.1.2:
Solution |
Bohr discovered an expression for the Rydberg constant or Rydberg frequency
using constants of nature:
RH=(me×e4 / 8x3 × e02) where
What units does the factor x have? What constant of nature is it?
|
| Exercise 2.7.1.3:
Solution |
What is the wavelength of the photon emitted from a transition between states n1=2 to n2=4? |